Writeup: Boston Key Party 2015 - Riverside
Information
- Category: network
- Points: 200
Description
A fellow hacker’s super secret login has been sniffed by the N$A. He provides the pcap file with USB traffic. He wants to know if he is screwed.
Writeup
What device?
The first step is obviously to find out what kind of device this traffic belongs to.
Since we are dealing with USB, we need to know that the host sends a packet of type GET_DESCRIPTOR Request DEVICE to the connected device, to request device informations. The device, in turn, responds with a GET_DESCRIPTOR Response DEVICE packet containing (among other informations) the idVendor and idProduct, which allow unique identification of the device.
Wireshark session
The initial part of the pcap has some GET_DESCRIPTOR Request DEVICE / Response DEVICE packets.
To list them all, apply the filter:
1 | usb.bDescriptorType == 0x01 |
There are many devices connected, but a quick look at the whole capture reveals that all the traffic is generated by the device labeled 12.
The corrisponding GET_DESCRIPTOR Response DEVICE is:

With fields:

It’s a mouse.
Get a clue
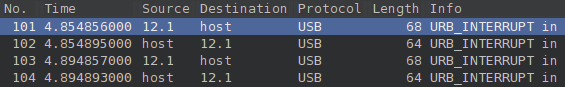
The mouse traffic is a long sequence of URB_INTERRUPT in requests and responses (in URB slang URB_SUBMIT and URB_COMPLETE) between the host and the device, starting at packet #101:
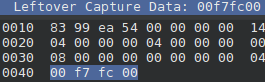
Long story short, on each interaction the host queries the mouse and the mouse replies with 4B of data, which can be seen in wireshark under the field leftover capture data. For example (packet #519):
Get the flow
The payloads can be extracted easily with tshark:
1 | $ tshark -Y "((usb.urb_type == 67) && (frame.number >= 101))" \ |
The result is a text file, so I set-up a ruby script to parse the packets:
Data processing
1 | packets = File.readlines('payload.txt').collect do |l| |
I found somewhere (!) the meaning of the mouse data. The first byte carries the information about the mouse clicks, while the two bytes in the middle are
respectively the x-axis speed and the y-axis speed. The fourth byte is for wheel scroll speed.
Thus, while the first byte is a bit mask, while the others are signed bytes.
Detail of the click data (byte 0):
| 7 | 6 | 5 | 4 | 3 | 2 | 1 | 0 |
|---|---|---|---|---|---|---|---|
| extra click | side click | wheel click | middle click | right click | left click |
On my script, I mapped the packets to actions, and derived the sequence of mouse coordinates integrating the speeds:
1 | # Map actions. |
Visualization
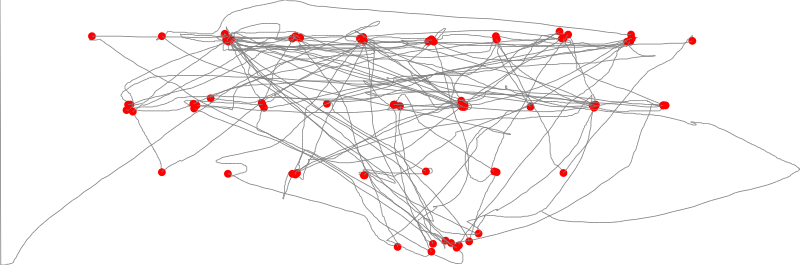
To visualize the mouse movements and clicks i decided to build an svg image using the rasem library (the calculations involving x/y min/max are just
translations have positive coordinates):
1 | require 'rasem' |
Which yields:
Reading the flag
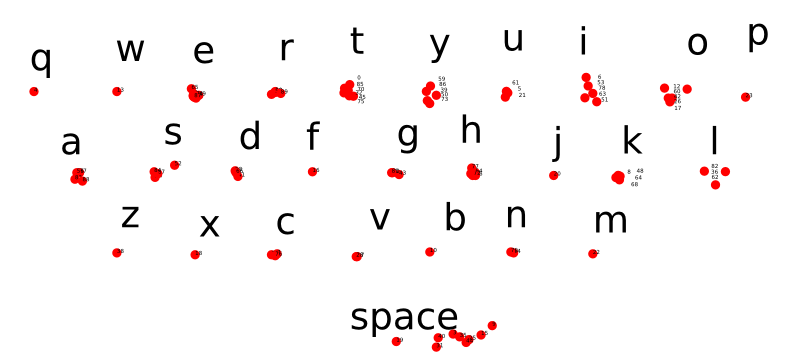
In the script, I picked the coordinates of each red hotspot, tagging them with the corresponding key. Then, I just matched each click with the nearest key:
1 | # Poor's man data clustering. |
Note The repeated letters (double v, double g) are due to the fact that the mouse button pressure is registered for two near polling cycles.